
JavaScriptでデバッグをするときconsole.log()を
使っているんだけど、少し効率的が悪いんだよね・・・。

簡易的にデバッグするのであればcosole.log()は便利だけど、
もっと効率的にデバッグができて、
詳細の情報が分かるデバッグ方法があるよ!
目次
VSCodeの機能を使ってデバッグをする
効率的にデバッグを行うにはブラウザの機能や、テキストエディタの機能を使います。
今回はVSCode(Visual Studio Code)のテキストエディタの機能を使ってデバッグをする方法を解説していきます。
以前はVSCodeでデバッグをするための拡張機能をインストールしないとデバッグの機能を使えませんでしたが、拡張機能が不要で簡単にデバッグができるようになりました。
デバッグの方法
STEP
VSCodeを開く
STEP
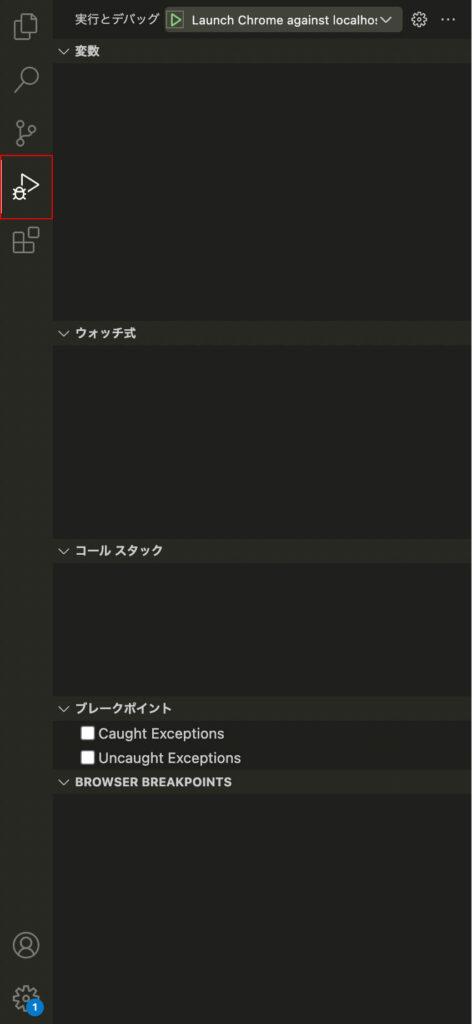
「実行とデバック」を選択する
この画面でデバッグの確認を行うことができるので、まず最初に開いておきます。
STEP
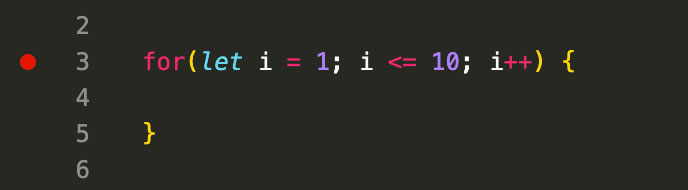
ブレークポイントを付ける
デバッグをしたい箇所に赤丸マークのブレークポイント付けます。
STEP
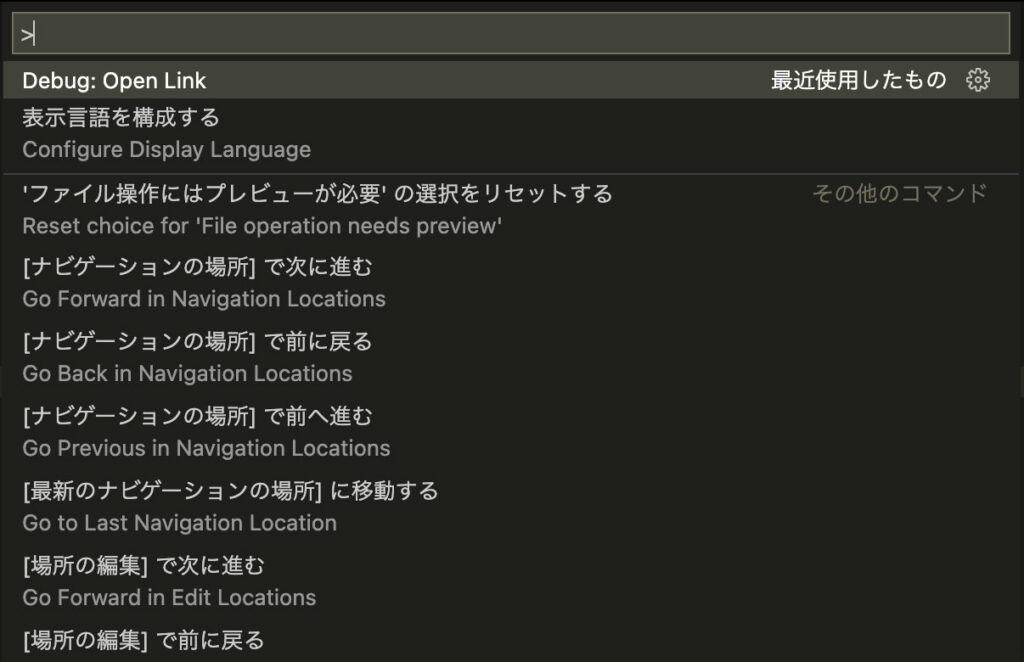
コマンドパレットを開く
command + shift + p を押してコマンドパレットを開きます。
コマンドパレットが開いたら「Debug: Open Link」で検索して選択し、エンターキーを押します。
STEP
開発環境用のURLを入力する
確認したい開発環境のURLを入力します。
画像のURLは例です。入力するURLには気を付けてください。

STEP
自動でブラウザが起動する
STEP
デバッグの内容を確認する
デバッグコンソールで変数の値を確認します。
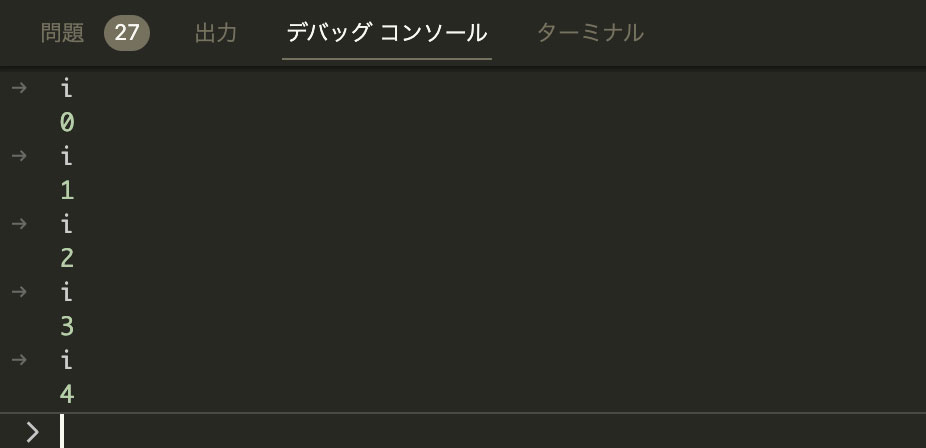
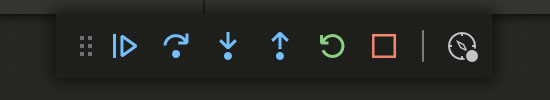
下記画像のツールが表示されるので矢印のボタンをクリックして次の処理に進めて確認することができます。
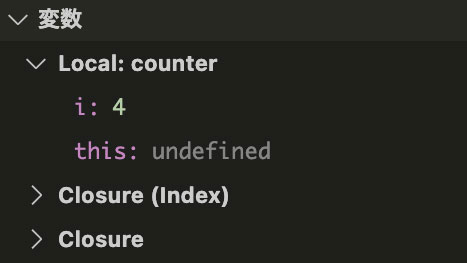
「実行とデバッグ」の変数欄には変数の状態が分かるのでより便利にデバッグをすることができます。
まとめ
- VSCodeの機能を使ってデバッグが行える
手順を覚えてしまえばVSCodeで簡単にデバッグができるよ!
console.log()しかデバッグの方法が分からなかったけど、
便利なデバッグの方法があるんだね!試してみる!